NASA, EPA Tackle NO2 Air Pollution in Overburdened Communities
4 Min Read
NASA, EPA Tackle NO2 Air Pollution in Overburdened Communities
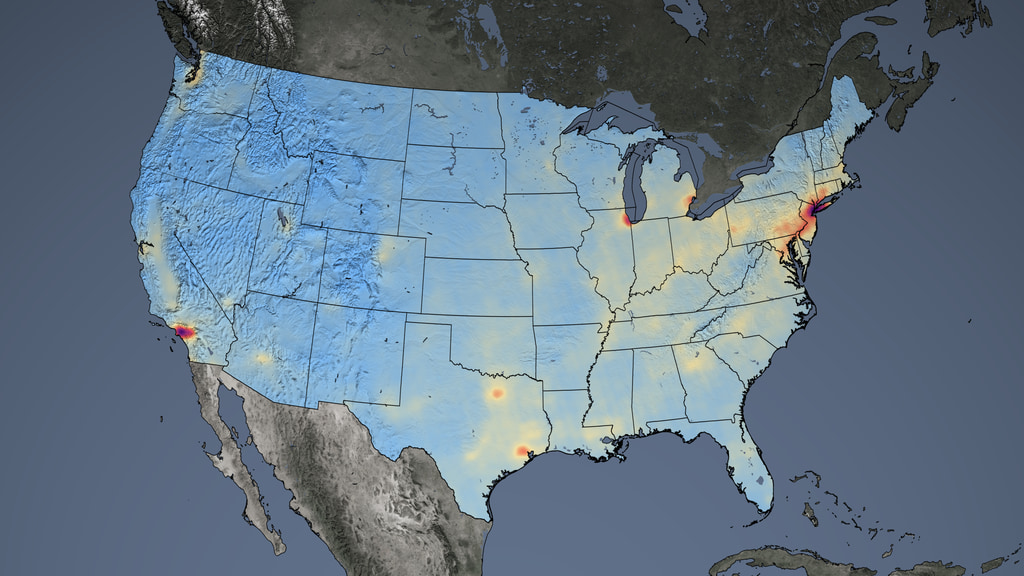
This map shows average concentrations of nitrogen dioxide for 2022 over the U.S., as detected by the Ozone Monitoring Instrument on NASA’s Aura satellite. Higher concentrations are in red and purple. Lower concentrations are in blue.
Credits:
NASA’s Scientific Visualization Studio
Earth (ESD)
- Earth Home
- Explore
- Climate...